
We move on from the why in learning-observability-part-1 to the how in this entry by using docker-compose to deploy a single node Elastic and Kibana service to the lab.
What and where are we deploying?
As mentioned in the first entry of this series, Elastic and Kibana will be serving as the logging infrastructure to our OpenTelemetry observability stack. Elastic can be a little resource intensive, but as long as we have 2 CPU cores, 4-8 GB of RAM, and 50-ish GB of disk we can have a decent lab setup. I am fortunate enough to have a spare 2011 Dell Optiplex 7010 with a 4-core Intel7 (with hyper threading), 32 GB of RAM ( DDR3-1600 so “not fast” by today’s standards), and a 500 GB SSD, which I will be using for this setup. These are cheap to get parts for, and you can usually find them in liquidation auctions or university surplus stores. Their price coupled with the low power consumption of 250 Watts, makes them a great lab machine.
The install
To begin, I installed the latest Ubuntu LTS release (22.04.3 aka Jammy Jellyfish) to serve as the host OS. I use Ansible to manage all of the machines in my lab, so I am going to skip the setup of Docker and other system dependencies since I automated it a long time again.
I am certain that there are more effective docker-compose setups for a single-node Elastic/Kibana, but with the kids, I am always short on time. I am simply going to reference the official Elastic blog with some minor modifications.
First, we need to set up some environment variables.
export ELASTIC_PASSWORD=changeme
export KIBANA_PASSWORD=changeme
export HOST_NAME=docker1.runcible.io
export STACK_VERSION="8.7.1"
export LICENSE=basic
export ES_MEM_LIMIT=8096000000
export KB_MEM_LIMIT=2048000000
export KIBANA_PORT=5601
export ES_PORT=9200
export COMPOSE_PROJECT_NAME=elasticlab
export CLUSTER_NAME=docker-cluster
export ENCRYPTION_KEY=$(python3 -c "import secrets;print(secrets.token_urlsafe(32))" | tee xpack_encryption_key.txt)
Note if you reviewed the Elastic blog post above, I have removed Logstash, Filebeat, and Metricsbeat from this setup since we will be using the Opentelemetry collector. I've also copied the ENCRYPTION_KEY to a clear text file for later use. Once again, I don't care about security since this is just a lab. You do what you want. I've also added my machine's HOST_NAME which will be included in the cert, allowing me to use the CA that is generated in curl commands to the Elastic API using the hostname.
# docker-compose-elastic.yaml
version: "3.8"

volumes:
  certs:
    driver: local
  esdata01:
    driver: local
  kibanadata:
    driver: local

networks:
  default:
    name: elastic
    external: false

services:
  setup:
    image: docker.elastic.co/elasticsearch/elasticsearch:${STACK_VERSION}
    volumes:
      - certs:/usr/share/elasticsearch/config/certs
    user: "0"
    command: >
      bash -c '
        if [ x${ELASTIC_PASSWORD} == x ]; then
          echo "Set the ELASTIC_PASSWORD environment variable in the .env file";
          exit 1;
        elif [ x${KIBANA_PASSWORD} == x ]; then
          echo "Set the KIBANA_PASSWORD environment variable in the .env file";
          exit 1;
        fi;
        if [ ! -f config/certs/ca.zip ]; then
          echo "Creating CA";
          bin/elasticsearch-certutil ca --silent --pem -out config/certs/ca.zip;
          unzip config/certs/ca.zip -d config/certs;
        fi;
        if [ ! -f config/certs/certs.zip ]; then
          echo "Creating certs";
          echo -ne \
          "instances:\n"\
          "  - name: es01\n"\
          "    dns:\n"\
          "      - es01\n"\
          "      - localhost\n"\
          "      - ${HOST_NAME}\n"\
          "    ip:\n"\
          "      - 127.0.0.1\n"\
          "      - 0.0.0.0\n"\
          "      - ${HOST_IP}\n"\
          "  - name: kibana\n"\
          "    dns:\n"\
          "      - kibana\n"\
          "      - localhost\n"\
          "      - ${HOST_NAME}\n"\
          "    ip:\n"\
          "      - 127.0.0.1\n"\
          "      - ${HOST_IP}\n"\
          > config/certs/instances.yml;
          bin/elasticsearch-certutil cert --silent --pem -out config/certs/certs.zip --in config/certs/instances.yml --ca-cert config/certs/ca/ca.crt --ca-key config/certs/ca/ca.key;
          unzip config/certs/certs.zip -d config/certs;
        fi;
        echo "Setting file permissions"
        chown -R root:root config/certs;
        find . -type d -exec chmod 750 \{\} \;;
        find . -type f -exec chmod 640 \{\} \;;
        echo "Waiting for Elasticsearch availability";
        until curl -s --cacert config/certs/ca/ca.crt https://es01:9200 | grep -q "missing authentication credentials"; do sleep 30; done;
        echo "Setting kibana_system password";
        until curl -s -X POST --cacert config/certs/ca/ca.crt -u "elastic:${ELASTIC_PASSWORD}" -H "Content-Type: application/json" https://es01:9200/_security/user/kibana_system/_password -d "{\"password\":\"${KIBANA_PASSWORD}\"}" | grep -q "^{}"; do sleep 10; done;
        echo "All done!";
      '
    healthcheck:
      test: [ "CMD-SHELL", "[ -f config/certs/es01/es01.crt ]" ]
      interval: 1s
      timeout: 5s
      retries: 120

  es01:
    depends_on:
      setup:
        condition: service_healthy
    image: docker.elastic.co/elasticsearch/elasticsearch:${STACK_VERSION}
    labels:
      co.elastic.logs/module: elasticsearch
    volumes:
      - certs:/usr/share/elasticsearch/config/certs
      - esdata01:/usr/share/elasticsearch/data
    ports:
      - ${ES_PORT}:9200
    environment:
      - node.name=es01
      - cluster.name=${CLUSTER_NAME}
      - discovery.type=single-node
      - ELASTIC_PASSWORD=${ELASTIC_PASSWORD}
      - bootstrap.memory_lock=true
      - xpack.security.enabled=true
      - xpack.security.http.ssl.enabled=true
      - xpack.security.http.ssl.key=certs/es01/es01.key
      - xpack.security.http.ssl.certificate=certs/es01/es01.crt
      - xpack.security.http.ssl.certificate_authorities=certs/ca/ca.crt
      - xpack.security.transport.ssl.enabled=true
      - xpack.security.transport.ssl.key=certs/es01/es01.key
      - xpack.security.transport.ssl.certificate=certs/es01/es01.crt
      - xpack.security.transport.ssl.certificate_authorities=certs/ca/ca.crt
      - xpack.security.transport.ssl.verification_mode=certificate
      - xpack.license.self_generated.type=${LICENSE}
    mem_limit: ${ES_MEM_LIMIT}
    ulimits:
      memlock:
        soft: -1
        hard: -1
    healthcheck:
      test:
        [
          "CMD-SHELL",
          "curl -s --cacert config/certs/ca/ca.crt https://localhost:9200 | grep -q 'missing authentication credentials'"
        ]
      interval: 10s
      timeout: 10s
      retries: 120

  kibana:
    depends_on:
      es01:
        condition: service_healthy
    image: docker.elastic.co/kibana/kibana:${STACK_VERSION}
    labels:
      co.elastic.logs/module: kibana
    volumes:
      - certs:/usr/share/kibana/config/certs
      - kibanadata:/usr/share/kibana/data
    ports:
      - ${KIBANA_PORT}:5601
    environment:
      - SERVERNAME=kibana
      - ELASTICSEARCH_HOSTS=https://es01:9200
      - ELASTICSEARCH_USERNAME=kibana_system
      - ELASTICSEARCH_PASSWORD=${KIBANA_PASSWORD}
      - ELASTICSEARCH_SSL_CERTIFICATEAUTHORITIES=config/certs/ca/ca.crt
      - XPACK_SECURITY_ENCRYPTIONKEY=${ENCRYPTION_KEY}
      - XPACK_ENCRYPTEDSAVEDOBJECTS_ENCRYPTIONKEY=${ENCRYPTION_KEY}
      - XPACK_REPORTING_ENCRYPTIONKEY=${ENCRYPTION_KEY}
    mem_limit: ${KB_MEM_LIMIT}
    healthcheck:
      test:
        [
          "CMD-SHELL",
          "curl -s -I http://localhost:5601 | grep -q 'HTTP/1.1 302 Found'"
        ]
      interval: 10s
      timeout: 10s
      retries: 120
Let's spin this up.
docker-compose -f docker-compose-elastic.yaml up -d
You should now have an instance of Kibana hosted on port 5601 of your machine.
Next we will create a Index Lifecycle Management Policy. There could be a lot of optimization you can do here in the process of moving data between phases to deletion. For this setup, we are going with a simple 30-day retainment policy all on "hot" storage, which is fine because we don't have a multinode setup.
I find it easiest to use the Dev Tools for this, but you could also choose to use the ReST API. Go to Menu > Management > Dev Tools, enter the following policy object (adjusted to your needs), and submit it.
PUT _ilm/policy/otel_daily_rollover_policy
{
  "policy": {
    "phases": {
      "hot": {
        "actions": {
          "rollover": {
            "max_age": "1d"
          }
        }
      },
      "delete": {
        "min_age": "30d",
        "actions": {
          "delete": {}
        }
      }
    }
  }
}
For any of the API requests we make, you should receive a 200 - OK response containing:
{
  "acknowledged": true
}
Now we want to create an index template. Since this is a single-node cluster we are just going to specify shards and replicas as 1. We will apply our otel_daily_rollover_policy, and include an alais for rollover. This alais "otel-logs-lab" will make it easier for us in our OTEL collector to specify one index to ship events to, and Elastic will store them in the active index for us.
PUT _index_template/otel_logs_template
{
  "index_patterns": ["otel-logs-lab-*"],
  "template": {
    "settings": {
      "number_of_shards": 1,
      "number_of_replicas": 1,
      "index.lifecycle.name": "otel_daily_rollover_policy",
      "index.lifecycle.rollover_alias": "otel-logs-lab"
    }
  }
}
Before accepting any documents from our collector we have to create the first "active" index. Here I am using support for date math in index names.
PUT /%3Cotel-logs-lab-%7Bnow%2Fd%7D%3E
{
  "aliases": {
    "otel-logs-lab": {
      "is_write_index": true
    }
  }
}
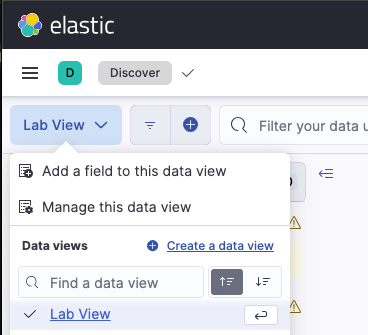
Our last task is to create a Data View that will cover all the indexes for our OTEL logs. Open up Discover and then open the data view menu. Select "Create a data view".
Now create a view with a name and the index pattern otel-logs-lab-*.
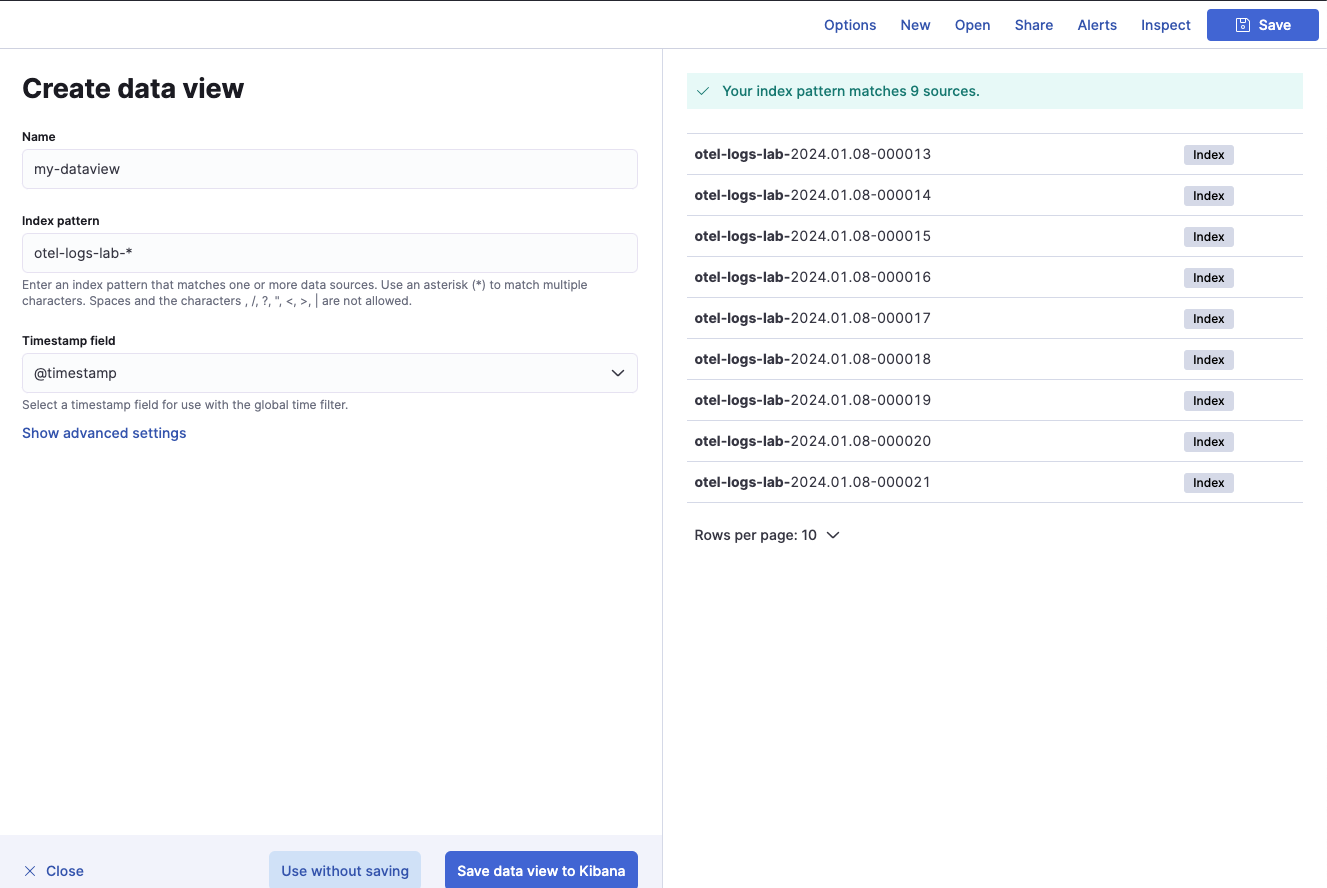
With this in place we are now ready to receive logging data from an OTEL Collector.
Up next
The next entry in this series will cover adding the OTEL Collector to a Kubernetes cluster to export logs to our new Elastic infrastructure.